Can pro-environmentalists get to zero metric tons?
April 2017, Robin Quirke
Introduction
According to the World Bank (2014), the average American emits 16.5 metric tons per capita per year. With the goal of sustaining life on Earth, science-based best practices suggest the United States has already exceeded its global allowance of released GHG emissions into the atmosphere. Therefore American individuals are ideally working towards reducing their annual carbon footprints down to zero metric tons by radically decreasing their carbon-emitting behaviors and purchasing carbon offsets to compensate for unavoidable carbon emissions.
One would predict that people with strong pro-environmental values would have small carbon footprints (defined here as 2-5 or less metric tons per year), but do they actually walk the talk? PolicyInteractive decided to assess the carbon footprints of people with strong pro-environmental values to see how they compare to the carbon footprints of the general public (N = 503).
Using car travel, air travel, and square footage of home as a proxy for carbon footprint, results showed carbon footprints to be a bit smaller for the pro-environmental sample than for the general public sample, but few pro-environmental participants were even close to having what can be considered a small, sustainable annual carbon footprint.
Keeping in mind this was a non-probability sample, see below for key findings, bar charts, methodology, and full results.
Key findings
1. Driving: Pro-environmental drove a little less
Both groups were asked “Approximately how many miles do you drive or ride in a car or truck EACH WEEK (not including work-paid driving) within the categories provided below (this includes using car shares and borrowing a car)?” Among the pro-environmental sample, 37% reported driving more than none but less than 40 miles a week, while only 24% of the general public sample reported driving less than none but less than 40 miles per week. Click on bar chart link below to see complete data report.
Click here to see Miles Driven bar chart
2. Driving: Pro-environmental cars a little more fuel-efficient
Looking at fuel efficiency of the vehicle used the most, there was little variation between the pro-environmental sample and the general public sample, although the pro-environmental group showed a slight leaning towards more fuel efficiency. Not one respondent from the general population sample reported using an alternative fuel, while 2% of the pro-environmental group does not use a petroleum-fueled vehicle.
Click here to see Fuel Efficiency bar chart
3. Size of home: Pro-environmental homes a little smaller
Participants were asked the approximate square footage of their homes, which was then divided by the number of people living in their home. The pro-environmental group reported living in less square feet than the general public group, with 35% of them living in homes with 200-400 square feet per person while only 24% of the general public group reported living in homes with 200-400 square feet per person.
Click here to see Home Size bar chart
4. Air travel: Pro-environmental used more air travel
The pro-environmental sample reported using more air travel than reported by the general public sample. Participants were asked “How many hours do you estimate you spent flying LAST YEAR for PERSONAL REASONS (such as vacations, etc.; not work-related)?” While only 36% of the pro-environmental group reported they did not use air travel at all the previous year, 54% of the general public group reported they did not use air travel.
Click here to see Air Travel bar chart
5. Air travel: Pro-environmental would fly more if they could
Respondents who did not use air travel from both groups were asked why they did not use air travel the previous year. Only 7% of the pro-environmental group reported not using air travel because they try to keep their carbon footprint small, and 50% of the pro-environmental group reported not using air travel in the previous year because they either did not have enough money or did not have an opportunity. In other words, if they had the money and/or opportunity, 50% of the pro-environmentalists who did not use air travel would have used air travel.
Click here to see Reason No Fly bar chart
(Air travel: Is it significant?)
To get a sense of how significant air travel is, it is helpful to compare average per capita carbon emissions to some flights. According to the World Bank (2013), the global average for annual per capita carbon emissions is 5 metric tons (MT). The World Bank estimates the average per capita carbon emissions for the U.S. to be 16.4 MT, Iceland’s average is 6.1 MT, India’s is 1.6 MT, and Kiribati’s (which has some of the world’s first global warming climate refugees) is 0.6 MT. A roundtrip flight between Portland, Oregon and Washington D.C. is 2.1 metric tons of carbon emissions and a roundtrip between Portland, Oregon and Hawai’i is 2.3. Therefore one flight has the potential to consume a person’s one-year share of carbon emissions.
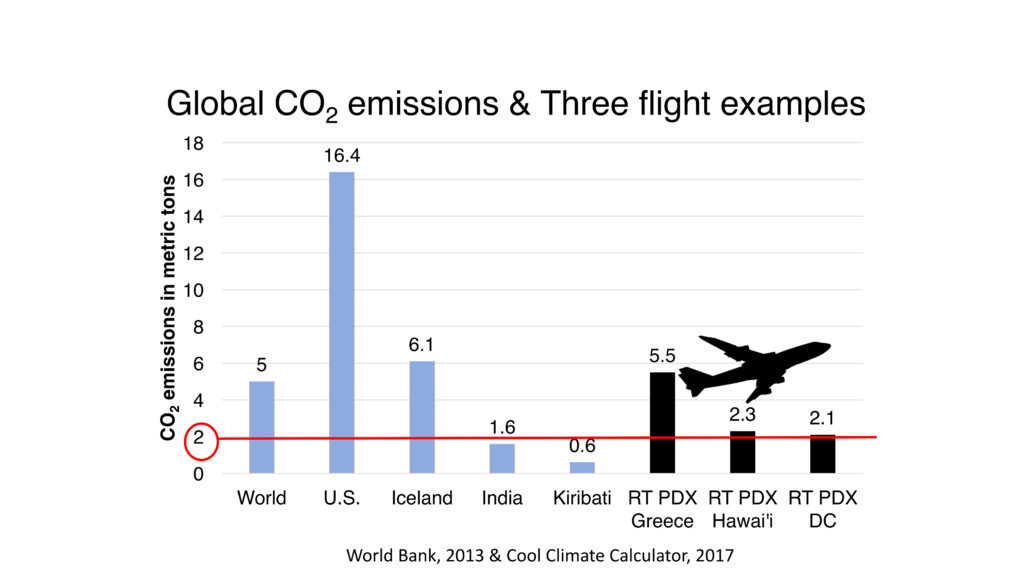
Click here to enlarge CO2 Footprints & Three Flights
Conclusion: Pro-environmentalists are not walking their talk
The pro-environmental group have carbon footprints that are nowhere near a sustainable size, although they appear to have slightly smaller carbon footprints than the general public. Using the carbon footprint proxy of drive, home, and fly, only 17% of the people within the pro-environmental group are even remotely close to the 2 metric tons annual goal.
Methodology & Transparency
Surveys were collected via opt-in online survey among two nonprobability samples: (1) Americans who specifically identify as having strong environmental values (263 participants), and (2) Americans from the general public (240 participants).
This study was sponsored, conducted, and funded by PolicyInteractive. The pro-environmental sample came from environmentalist online Reddit communities (214 respondents) and from Mechanical Turk (48 respondents). The general public sample was acquired through Mechanical Turk. Participants from both groups were American and 19 years of age or older. Reddit respondents were not paid; Mechanical Turk respondents were paid a token of $.33 each. The reported data is not weighted. These surveys were administered during the month of November in 2015, and only in English. Demographic details, complete surveys and full results at links below.
Comments, questions, inquiries: info@policyinteractive.org