City Club of Eugene: STAR voting
On June 1st, 2018, the City Club of Eugene discussed an alternative voting system called STAR voting. First, voters Score the candidates on a 0-5 scale, Then there is an Automatic Runoff. Advocates are gathering signatures to qualify this proposal as a measure on the general election ballot in November of 2018. Panelists included STAR voting advocates Mark Frohnmayer (from the Arcimoto electric vehicle company) and Alan Zundel (retired political science professor), along with Robin Quirke (PolicyInteractive) as the friendly critic.
Listen to full City Club discussion here.
Visual representation of Quirke’s portion of the discussion:
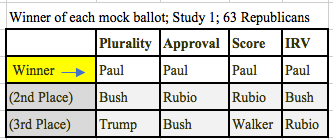
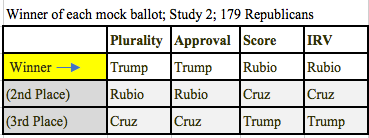
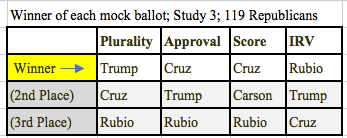
In 2015 and 2016, using electronic mock 2016 presidential election ballots, PI invited online survey respondents to vote for their preferred candidates using the standard U.S. voting system of plurality, along with three championed alternatives: approval voting, score voting, and ranked-choice voting (RCV or IRV). Quirke focused on the following three points, based on study results:
1. Do winners vary when an alternative voting system is used? (Results and methodology)
2. Which voting systems do voters prefer? (Results and methodology)
3. How we might use research to help advise voting system reform decisions?
Each of these three points are discussed below, with bar charts and data tables to help illustrate.
1. Do winners vary when an alternative voting system is used?
Answer: Sometimes
July 2015 (IRV is the same as RCV)
January 2016 (IRV is the same as RCV)
March 2016 (IRV is the same as RCV)
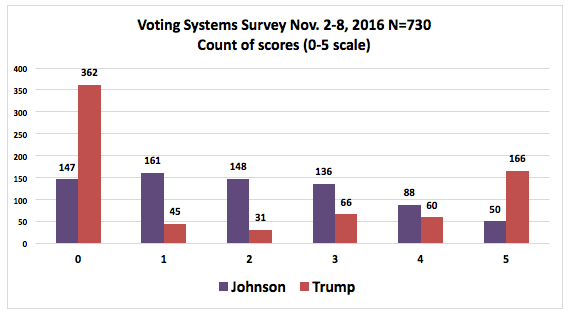
November 2-8, 2016
In a survey conducted along side Center for Election Science (CES), we matched voter turnout in the 2016 general election. Of our 730 survey-takers, 33% were registered as Republicans, 36% as Democrats, and 31% for everything else.

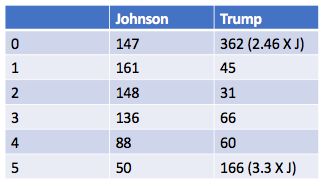
2. Which voting systems do voters prefer?
Answer: the current system (plurality voting)
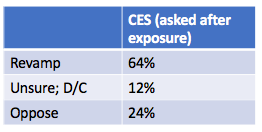


3. How we might use research to help advise voting system reform decisions?
- Exit polls (page iii) in San Francisco found that younger, English-speaking, more formally educated voters were the ones who most liked RCV, so be sure to test it among those who are often left out of political decisions
- Consider a ‘No opinion’ option to reduce cognitive load
- Make average score available as well instead of total score (makes the results more intuitive)
- Consider using simple score voting without the instant runoff feature (there are downsides to only having one election, and instant runoffs make the calculations more complicated)
(Pippa Norris: Electoral Integrity Project)
Quirke referenced Pippa Norris from Harvard, and the Electoral Integrity Project. This project is at: https://www.electoralintegrityproject.com. Norris’s book Why elections fail (2015), outlines how 97 countries were assessed regarding electoral integrity (using the Perceptions of Electoral Integrity (PEI) questionnaire), including the U.S., whose electoral integrity score tied with South Africa, Mexico, and Barbados (pg. 54). The U.S. scored lower than many countries that are considered developing nations. Norris writes “Experts expressed concern about problems of US electoral law [“unfair to smaller parties” as one aspect of this (pg. 39)], voter registration, and partisan gerrymandering in the process of drawing district boundaries, as well as the regulation of campaign finance” (pg. 57). The U.S. PEI score (70) is the average of individual state scores, which ranged from the lowest of Arizona (53) to the highest of Vermont (75). It is worth noting that Vermont’s highest score does not reach the scores of Norway (87), Costa Rica (84), or Lithuania (82), as well as several other countries.